Three fixes to the melt pool model: surface-active elements, mesh and powder entry
The 612 W transient run (med mesh, σ from the Thermo-Calc TCFE15 table) gives a pool that is too shallow and too wide: depth-to-width ratio 0.130 (cold-state estimate 0.140) against a measured 0.186. Analysis of the simulation found three sources of error:
- The Thermo-Calc surface-tension table leaves out the adsorption of surface-active elements (oxygen O, sulfur S) on the liquid surface, so dσ/dT is positive only in a narrow window of 1850–1926 K (with sulfur adsorption included it is positive everywhere below about 2048 K). As a result the surface flow at 612 W is mainly outward and flattens the pool, whereas the measurement needs an inward flow that deepens the pool by about 35%.
- The mesh near the pool surface, although refined (24 µm along the scan direction, 12 µm transverse and vertical), is still not fine enough for the surface flow: the surface speed is about 26% too low, and about 83% of the downwelling flux where the surface flows converge is lost.
- Powder is added at the free surface, whereas real particles melt only about 50–200 µm below the liquid surface. This makes the surface powder-rich (median f 0.419, bulk about 0.30) and so the sulfur content at the surface too low (about 52 against 63 ppm).
0 The three fixes at a glance
| Fix | What is done | Result | Status | |
|---|---|---|---|---|
| 1 | Surface-active elements | The σ table is replaced by one that includes sulfur adsorption: sulfur 90·(1 − f) ppm, adsorption constants from the literature, oxygen dissolved at the surface set to zero, no adjustable quantity (1.3 appendix) | In the steady model the effect of the flow has the measured direction at all four powers: flow factor 1.351, 1.144, 0.740, 0.688, required by the measurement 1.35, 0.99, 0.72, 0.61; with the 612 W area matched the depth-to-width ratio is 0.177 (measured 0.186) | Steady and transient runs now both use this table; the transient on the coarser mesh still does not deepen (depth-to-width ratio 0.132, cold 0.139) |
| 2 | Mesh | Refined near the surface to 12.5 µm along the surface and 8 µm vertically (G3); G4, with 4 µm vertically, entrains gas once in the pool and is unstable, and has been dropped | In the converging-flow cavity the G3 cell shape gives a downwelling flux 10 / 13 / 18% below the reference (12 / 24 / 48 µm below the surface) and a surface speed lower by 5% (hot side), 11% (cold side) | The G3 production run is on the workstation (125 → 256.25 ms), expected to finish on 10-11; it tests whether, with the finer mesh, the sulfur-only table deepens the 612 W transient |
| 3 | Powder entry | Release the powder below the liquid surface (not done yet) | The upper bound of its effect is known: with σ looked up at the nominal composition, i.e. composition coupling removed entirely, the 612 W transient still does not deepen (depth-to-width ratio 0.137); this fix has a limited effect on depth and mainly affects the composition at the surface and the bead top | To be done; a vertical EDS line scan through the bead can tell directly whether the bead top is powder-rich |
1 Fix 1: surface-active elements (oxygen, sulfur)
The model results in this section come from the steady moving-frame model (S model): a steady solution in the frame moving with the beam, with the free surface fixed to the measured bead; same material properties, beam and powder rule as the transient model. All geometry goes through the experiment's own measuring function (0822 curves).
1.1 Observation: with power the section changes from parabolic to flat-bottomed with steep walls
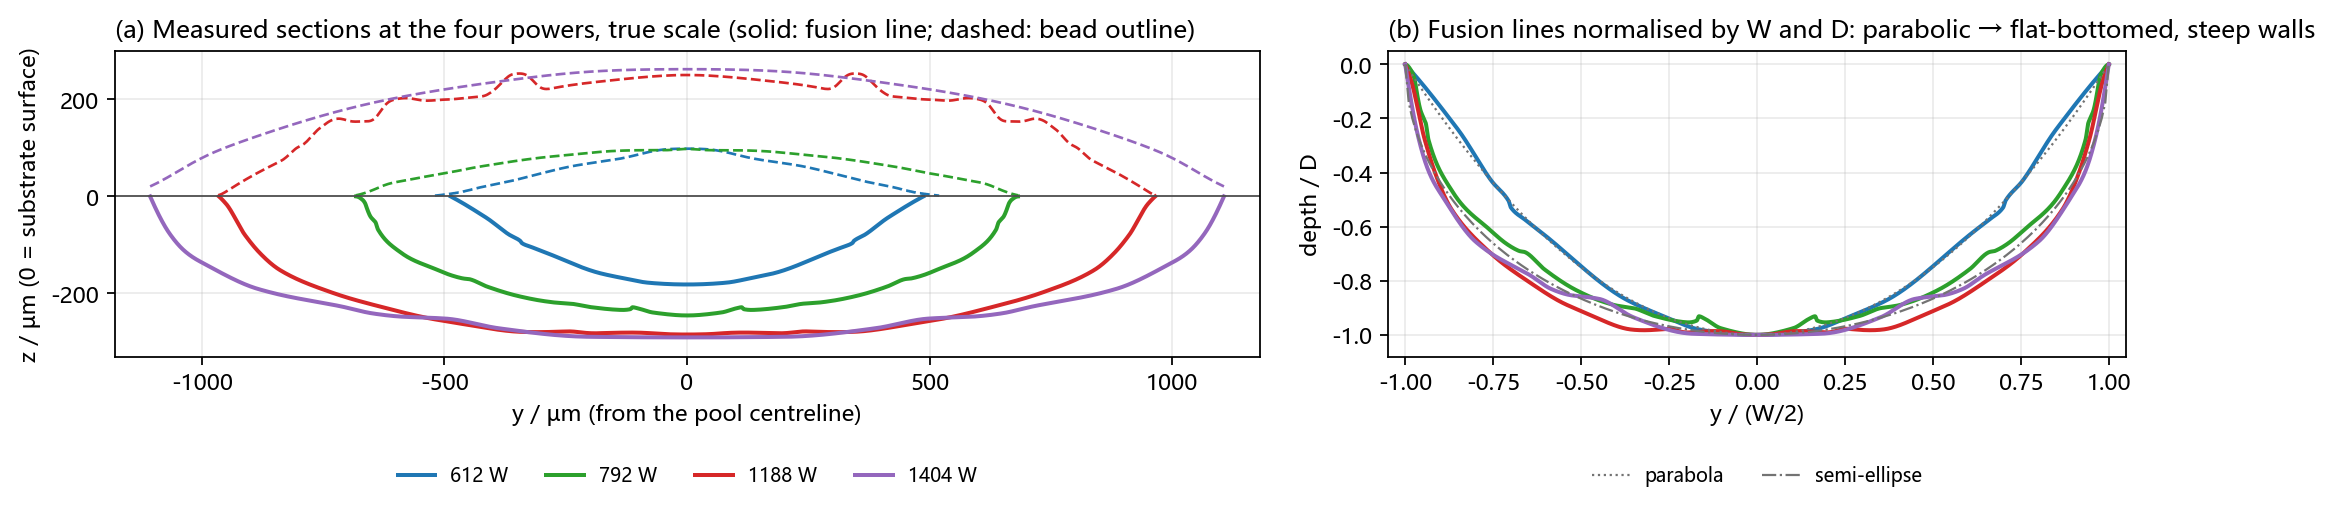
| Power | Width W / µm | Depth D / µm | D/W | Fullness A/(W·D) | Shoulder-depth ratio d(W/4)/D | Wall-depth ratio d(0.4W)/D |
|---|---|---|---|---|---|---|
| 612 W | 974.2 | 181.5 | 0.186 | 0.663 | 0.746 | 0.341 |
| 792 W | 1363.9 | 245.3 | 0.180 | 0.748 | 0.844 | 0.567 |
| 1188 W | 1929.7 | 284.6 | 0.147 | 0.807 | 0.912 | 0.645 |
| 1404 W | 2213.2 | 290.5 | 0.131 | 0.798 | 0.858 | 0.655 |
| Parabola / semi-ellipse | 0.667 / 0.785 | 0.750 / 0.866 | 0.360 / 0.600 |
At 612 W the section coincides with a parabola; from 792 W the walls steepen; at 1188 and 1404 W it is fuller than a semi-ellipse. The depth-to-width ratio falls with power from 0.186 to 0.131.
1.2 Net effect of the flow: from deepening to flattening
With conduction only (flow switched off) at the same area, the depth-to-width ratio rises with power; the measured ratio falls with power. The measured ratio divided by the conduction-only ratio at the same area is the flow factor the measurement requires (above 1 means the flow deepens the pool):
| Power | Measured D/W | Conduction-only D/W (same area) | Required flow factor |
|---|---|---|---|
| 612 W | 0.186 | 0.138 | 1.35 |
| 792 W | 0.180 | 0.182 | 0.99 |
| 1188 W | 0.147 | 0.205 | 0.72 |
| 1404 W | 0.131 | about 0.216 | 0.61 |
1.3 The flow direction is set by the sign-change temperature Tc, and Tc by the substrate's sulfur
Oxygen and sulfur adsorb in the outermost layer of the liquid surface and lower σ; heating desorbs them and σ recovers, so dσ/dT > 0 at low temperature, up to the sign-change temperature Tc. Surface with dσ/dT > 0 is pulled towards the hot centre; surface with dσ/dT < 0 is pulled outward.
Of the two elements, it is the substrate's sulfur, not the powder's oxygen, that sets Tc. Oxygen comes in only with the powder (certificate 420 ppm; 100–180 ppm in the melt if all of it dissolves). Each element alone makes dσ/dT positive at low temperature; together they compete for the same surface sites: at low temperature sulfur holds the surface, on heating sulfur leaves, but oxygen takes the freed sites and does not leave, and per surface site oxygen lowers σ about three times as much as sulfur, so σ falls with temperature all the way. By the expression of Small et al. 1990 for simultaneous adsorption of oxygen and sulfur, dσ/dT is negative everywhere once the oxygen dissolved at the surface reaches 50 ppm, and the surface can only flow outward. A forward estimate puts the oxygen left at the surface far below that: the surface is swept by argon and the substrate's carbon turns dissolved oxygen into CO, which is carried away, leaving at most 4–17 ppm dissolved at the surface (premises and limits in section 1.6); inferred backward from the measured section shapes it is 0–15 ppm.
Sulfur comes only from the 4140 substrate (S 0.009 wt%, i.e. 90 ppm) and is diluted by the powder to 90·(1 − f) ppm; the higher the power, the larger the powder fraction f and the less sulfur, and Tc falls accordingly.
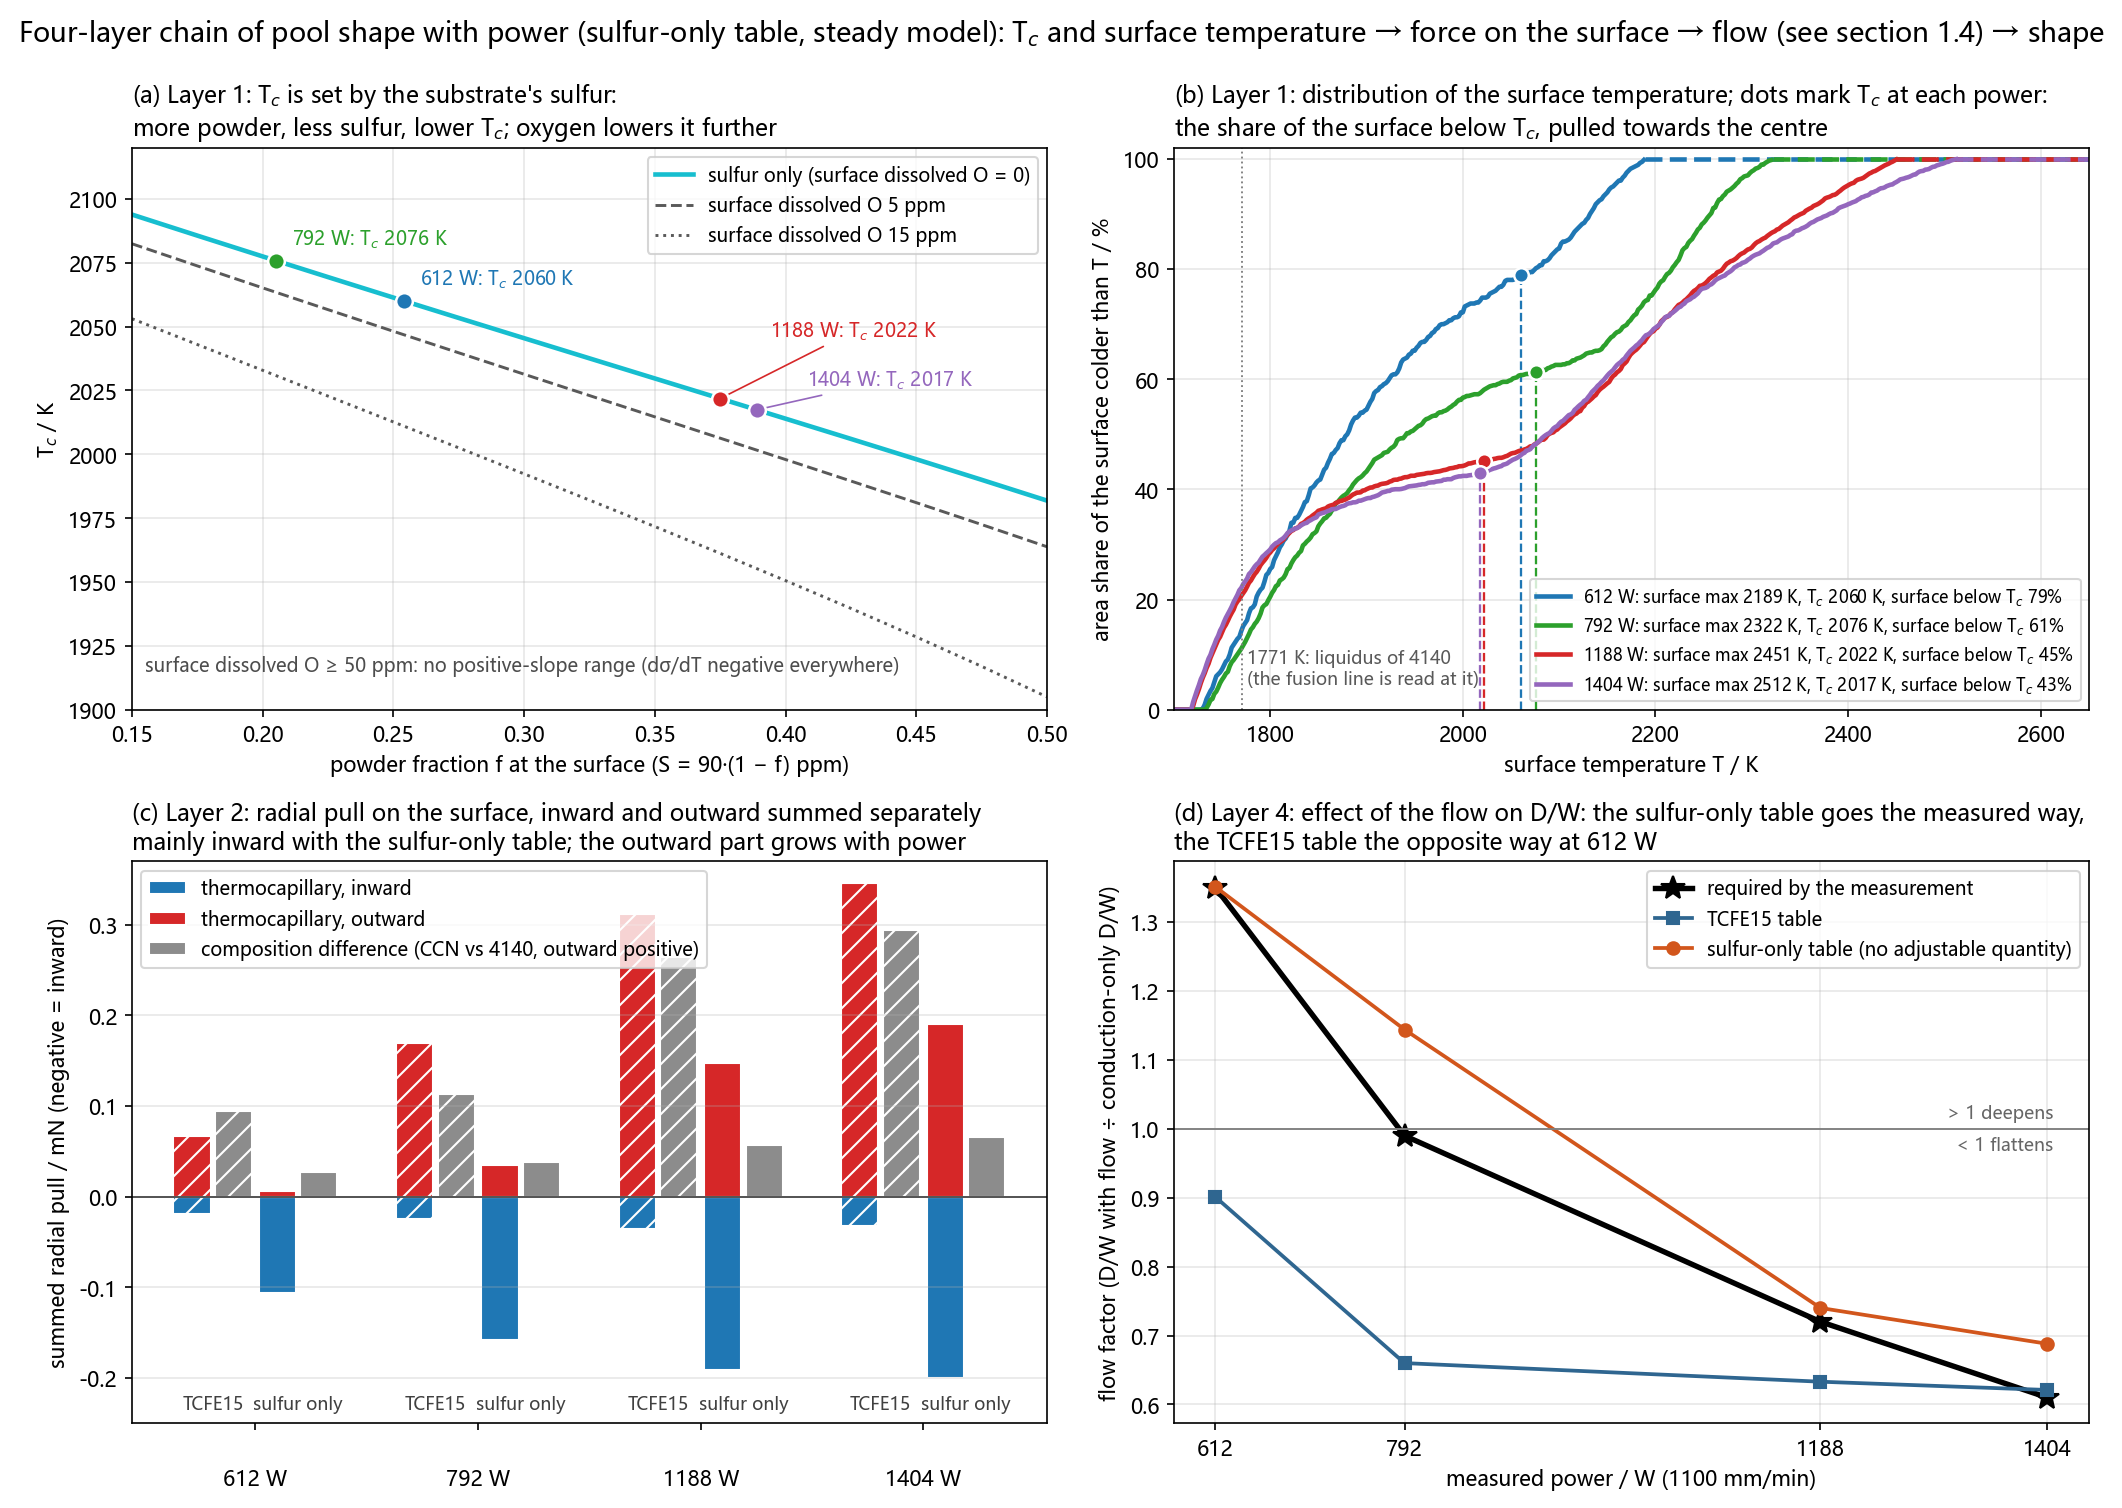
Higher power → more powder (larger f) → less sulfur → lower Tc. At the same time the surface temperature rises strongly; together the two enlarge the share of the surface above Tc. (a) Tc against surface composition and dissolved oxygen (literature expression); dots are the surface composition (median f) of the sulfur-only run at each power and its Tc; (b) distribution of the surface temperature: the vertical axis is the area share of the surface colder than T, and dots mark Tc at each power; (c) radial pull on the surface: thermocapillary inward and outward summed separately, the composition-difference term (CCN against 4140) listed apart, TCFE15 table against the sulfur-only table; (d) flow factor against power. (b) and (c) give only shares and summed pulls, not positions; for positions see the surface maps in section 1.4.
At 612 W most of the surface is below Tc and the whole of it is pulled towards the centre; at 1188 and 1404 W the hot core is above Tc: the outer ring of the surface moves inward, the inner part outward, and they converge and sink along the Tc isotherm, forming the flat bottom and steep walls.
1.3 appendix How Tc is calculated
First the clean surface tension σclean, without oxygen or sulfur, is calculated; then the lowering caused by oxygen and sulfur adsorbed on the surface is subtracted. σ first rises and then falls with temperature; its maximum (where dσ/dT turns from positive to negative) is Tc. All constants are taken from the literature; no parameter was adjusted for this case.
Γ is the saturation adsorption, K the adsorption equilibrium constant, a the activity and R the gas constant (8.314 J/(mol·K)). This is equation (8) of Small, Sahoo & Li 1990. Chia, Wang & Yan 2023 use the same expression in an additive-manufacturing melt pool model (their equation (10)). With sulfur only (aO = 0) it reduces to the single-solute form of Sahoo, DebRoy & McNallan 1988, σ = σclean − ΓSRT ln(1 + KSaS).
| Quantity | Value | Source |
|---|---|---|
| Clean metal: σclean | ||
| σclean | Multicomponent Butler equation: each component is in equilibrium between the surface layer and the bulk; the partial molar excess Gibbs energy of the surface layer is β = 0.75 times the bulk expression | Form of the equation: Tanaka & Iida 1994; β as in Costa 2014. The project's own P1 code reproduces the calculations of Costa 2014, Tanaka & Iida 1994 and Choe 2014 |
| Excess Gibbs energy | Muggianu extrapolation: GE = Σi<j xixj Σk Lij(k)(xi − xj)k, i.e. the Redlich–Kister terms of the binaries are simply added; x is the mole fraction in the multicomponent melt, and no ternary term is added | Costa 2014, equation (35) (Redlich–Kister–Muggianu model) |
| Binary parameters Lij | Co–Cr, Cr–Ni, Co–Ni: Costa 2014, Table 1; Fe–Cr: Choe 2014, Table 3; Fe–Co, Fe–Ni: Tanaka & Iida 1994, Table 3 | the project's own P1 code |
| Molar volume V, molar surface area A | V: Tanaka & Iida 1994, Table 2; A = 1.091 NA1/3V2/3 | Tanaka & Iida 1994, Table 2 and equation (2) |
| Pure Fe, pure Ni | 1.94 − 3.50×10⁻⁴ (T − 1808), 1.77 − 3.11×10⁻⁴ (T − 1728) N/m | Xiao & Brillo 2022, Table 3 (electromagnetic levitation, O < 0.003 at%) |
| Pure Co | 1.884 − 0.37×10⁻³ (T − 1768) N/m | Costa 2014, Table 1 (sessile drop) |
| Pure Cr | at 1850 K: 1.4202 N/m, slope −0.544 mN/(m·K) | level fitted to the 8 clean Fe–Cr and Ni–Cr alloys of Xiao & Brillo 2022, Table 3; slope from Chung 1992 |
| Melt composition | equiatomic CoCrNi at fraction f, 4140 taken as Fe–1Cr (mass fraction) at 1 − f | composition rule of P1 (the Mn, C, Si and Mo of 4140 are merged into Fe) |
| Oxygen: ΓO, KO, aO | ||
| ΓO | 2.03×10⁻⁵ mol/m² | Sahoo, DebRoy & McNallan 1988, Table III (Fe–O) |
| KO | k·exp(−ΔH°/(RT)), k = 0.0138, ΔH° = −146.3 kJ/mol | Sahoo, DebRoy & McNallan 1988, Table II (Fe–O) |
| aO | [%O], no correction for Cr | Lee, Yamamoto & Morita 2005: at 1823 K the relation between σ and [%O] hardly changes with Cr (0–30%) |
| Oxygen dissolved at the surface | 0 in the sulfur-only table; the figure below also takes 5, 15 and 50 ppm | actual value unknown; 420·f ppm if all the powder's oxygen (certificate 420 ppm) dissolves, see section 1.6 |
| Sulfur: ΓS, KS, aS | ||
| ΓS | 6.7×10⁻⁶ mol/m² | Su, Li & Mills 2005 (mean of 304, 316 and 430 stainless steels) |
| KS | ln KS = 28798/T − 8.5647, i.e. k = 1.91×10⁻⁴, ΔH° = −239.4 kJ/mol | Su, Li & Mills 2005, equation (7), fitted to measurements on stainless steels; for the check against Brooks & Quested 2005 see section 1.7 |
| aS | hS·[%S], lg hS = −0.011 [%Cr] + 0.0026 [%Co] (the Ni term is 0) | Sigworth & Elliott 1974, Table I |
| Sulfur content | 90·(1 − f) ppm; none in the powder | 4140 mill certificate, S 0.009 wt%; sulfur is not listed on the powder certificate |
| Surface composition and how Tc is taken | ||
| f | median f on the surface (fully liquid top-layer cells) of the sulfur-only runs: 612 W 0.254, 792 W 0.205, 1188 W 0.375, 1404 W 0.389 | steady runs; the dots in figure (a) of section 1.3 |
| Tc | σ(T) is evaluated every 2 K over 1740–2700 K, dσ/dT is taken by differences, and Tc is where it turns from positive to negative (linear interpolation) | tc_of in sigma_ads_model.py |
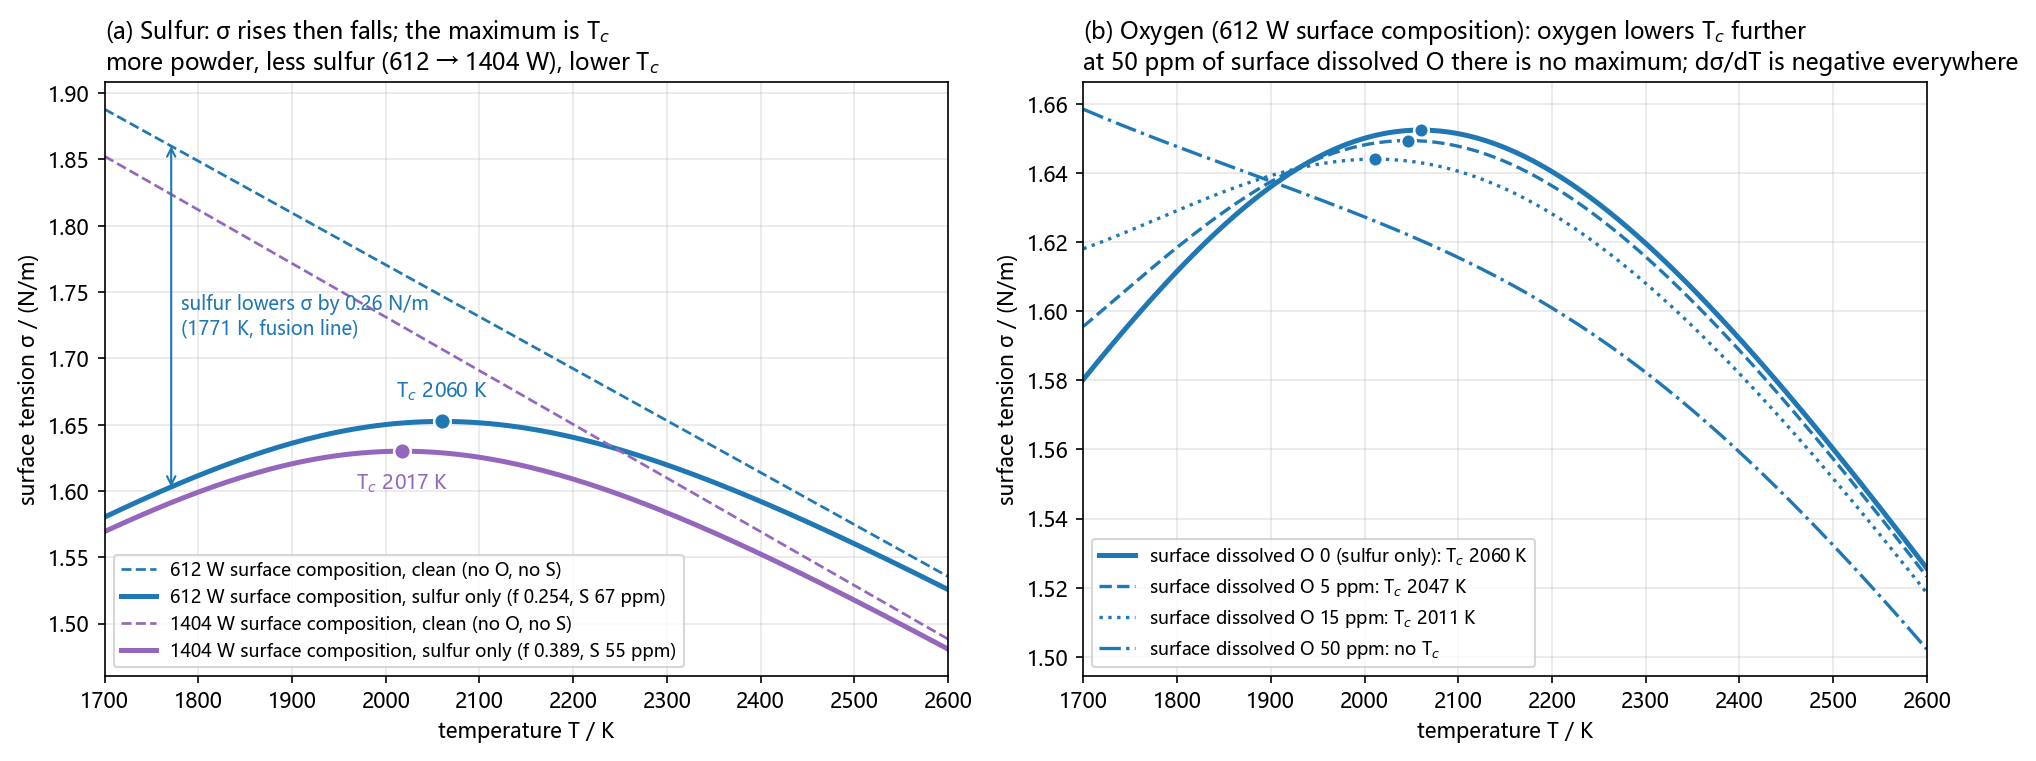
(a) Surface compositions of the sulfur-only runs at 612 W and 1404 W. At low temperature sulfur occupies the surface layer and σ is 0.26 N/m below the clean value (612 W, 1771 K); heating desorbs the sulfur and σ recovers, to within 0.014 N/m at 2500 K. Where this recovery balances the fall of the clean σ itself is the maximum, Tc: 2060 K at 612 W and 2017 K at 1404 W. (b) The 612 W surface composition with oxygen added: Tc falls to 2047 K (5 ppm) and 2011 K (15 ppm); at 50 ppm σ falls with temperature all the way and there is no Tc.
- Brooks R.F., Quested P.N. J. Mater. Sci. 40 (2005) 2233–2238. doi:10.1007/s10853-005-1939-2
- Chia H.Y., Wang L., Yan W. Acta Mater. 249 (2023) 118824. doi:10.1016/j.actamat.2023.118824
- Choe J., Kim H.G., Jeon Y., Park H.J., Kang Y., Ozawa S., Lee J. ISIJ Int. 54 (2014) 2104–2108. doi:10.2355/isijinternational.54.2104
- Chung W.B., Nogi K., Miller W.A., McLean A. Mater. Trans. JIM 33 (1992) 753–757. doi:10.2320/matertrans1989.33.753
- Costa C., Delsante S., Borzone G., Živković D., Novaković R. J. Chem. Thermodyn. 69 (2014) 73–84. doi:10.1016/j.jct.2013.09.034
- Lee J., Yamamoto K., Morita K. Metall. Mater. Trans. B 36 (2005) 241–246. doi:10.1007/s11663-005-0025-0
- Sahoo P., DebRoy T., McNallan M.J. Metall. Trans. B 19 (1988) 483–491. doi:10.1007/BF02657748
- Sigworth G.K., Elliott J.F. Metal Sci. 8 (1974) 298–310. doi:10.1179/msc.1974.8.1.298
- Small W.M., Sahoo P., Li K. Scripta Metall. Mater. 24 (1990) 1155–1158. doi:10.1016/0956-716X(90)90316-9
- Su Y., Li Z., Mills K.C. J. Mater. Sci. 40 (2005) 2201–2205. doi:10.1007/s10853-005-1933-8
- Tanaka T., Iida T. Steel Res. 65 (1994) 21–28. doi:10.1002/srin.199400921
- Xiao X., Brillo J. J. Mol. Liq. 360 (2022) 119599. doi:10.1016/j.molliq.2022.119599
1.4 612 W: from sulfur to depth (a pair of steady runs differing only in the σ table)
TCFE15 table against the sulfur-only table, both at η 0.395, on the same mesh and free surface.
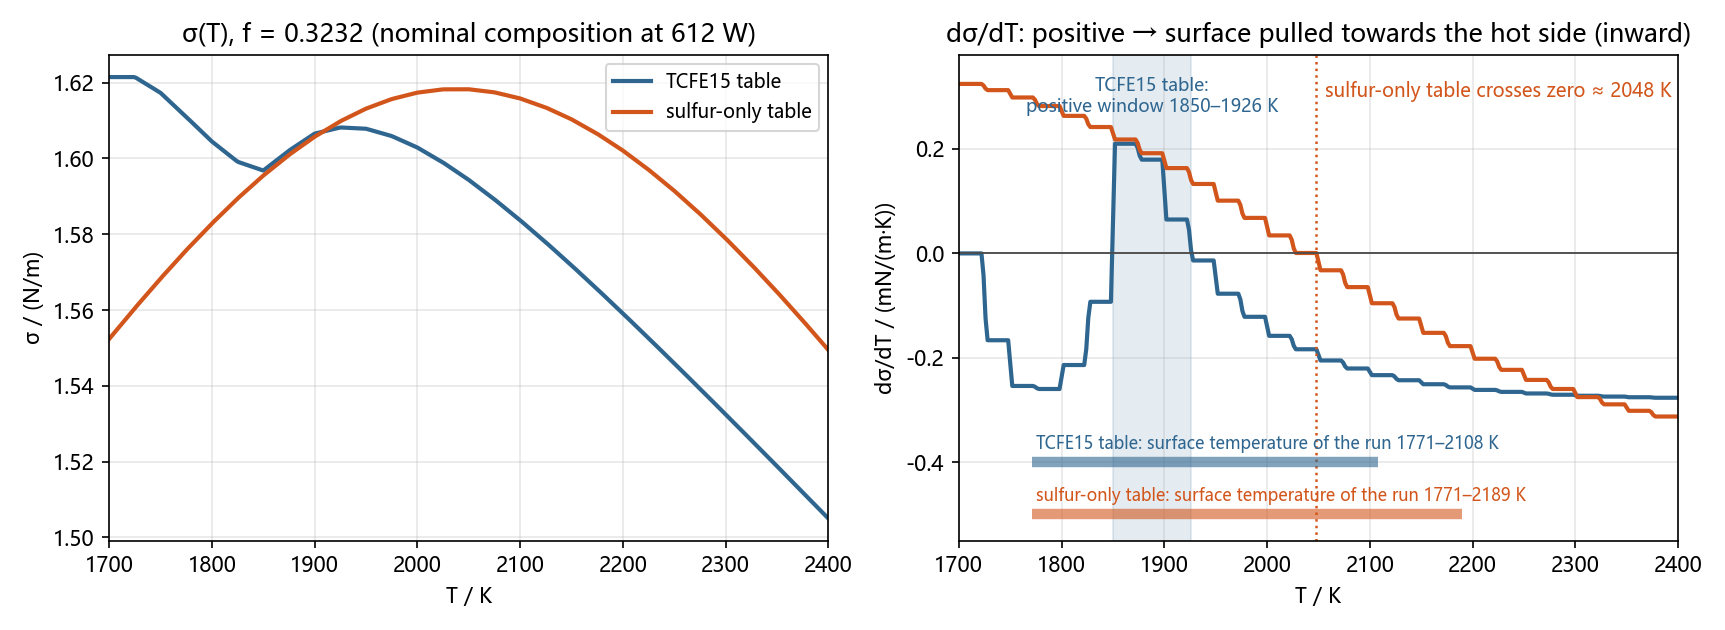
σ(T) and dσ/dT (f = 0.3232). The TCFE15 table is positive only in 1850–1926 K; the sulfur-only table is positive below about 2048 K.
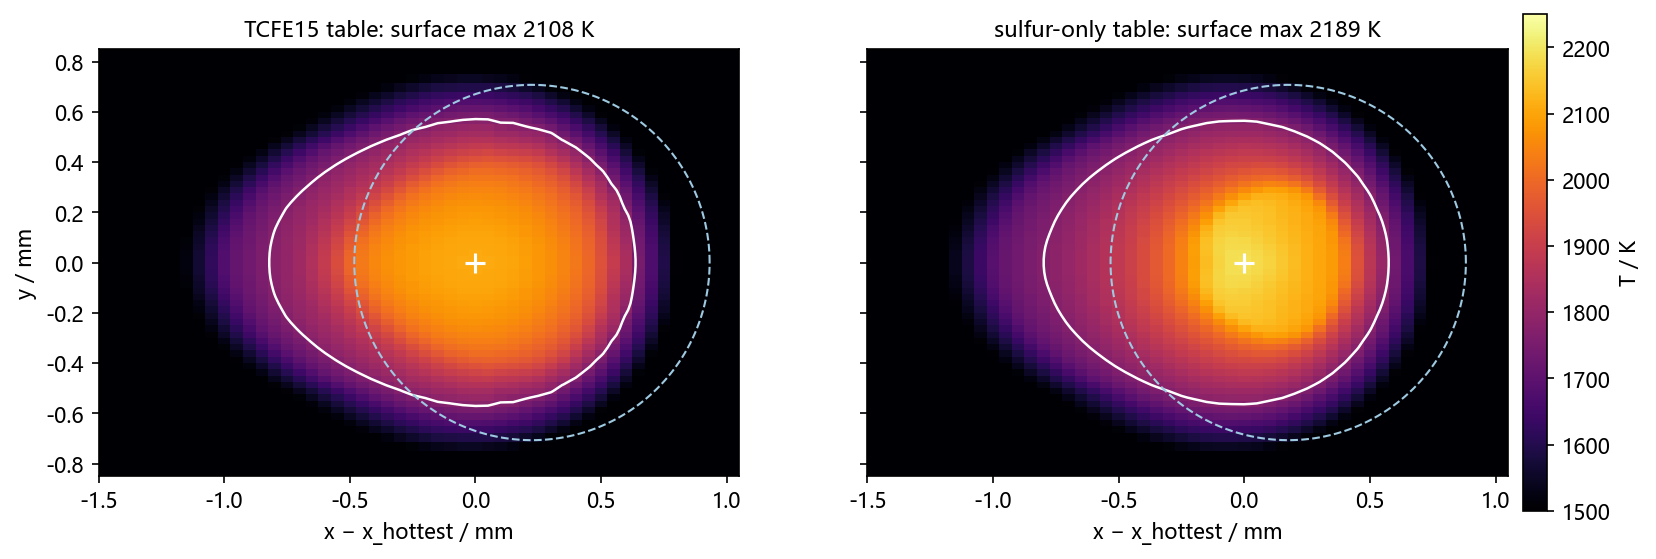
Surface temperature: maximum 2108 K with the TCFE15 table, 2189 K with the sulfur-only table.
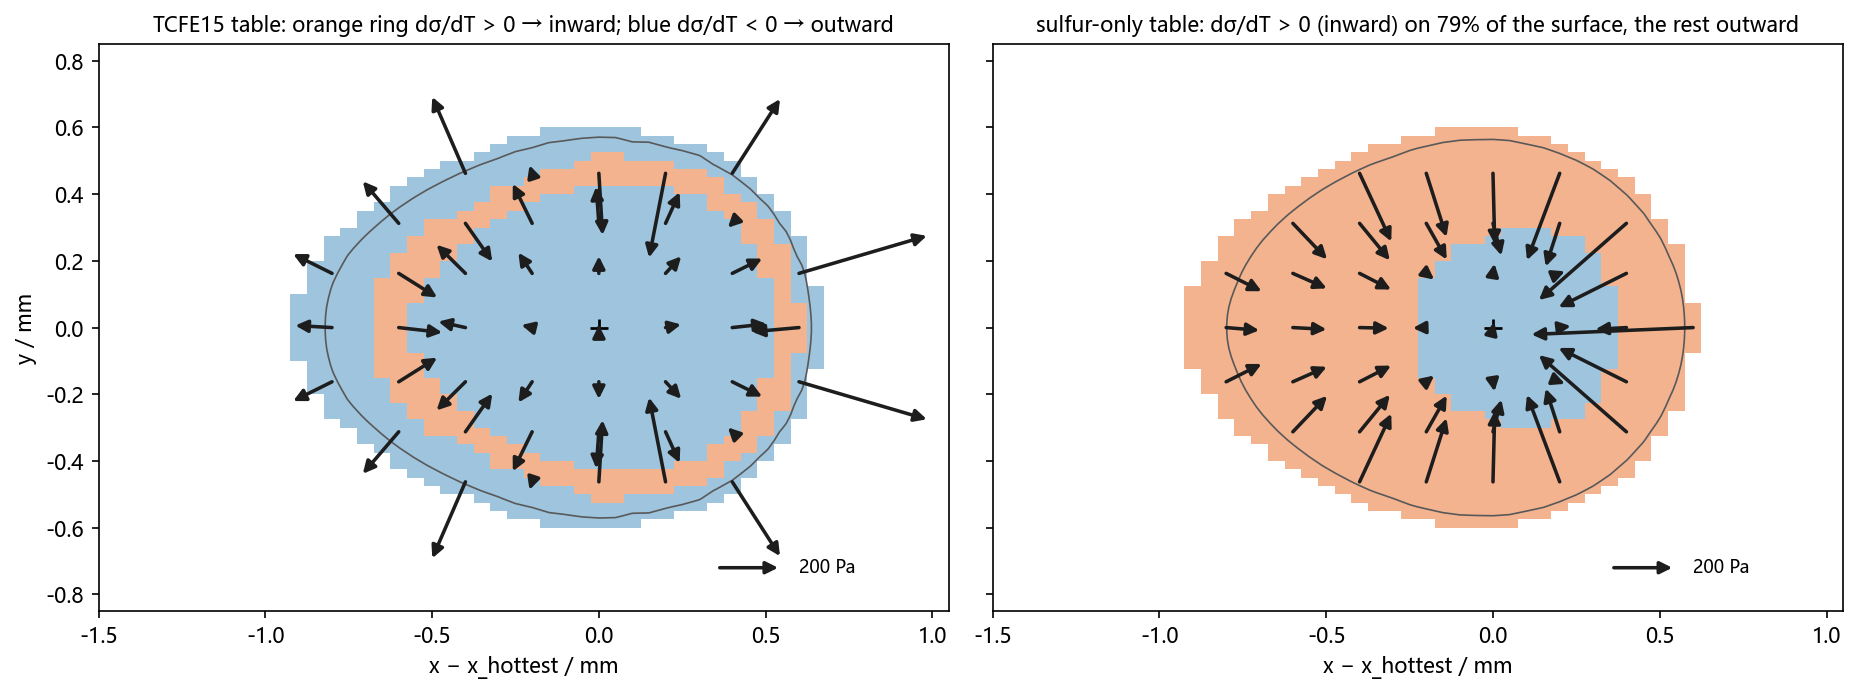
Direction of the thermocapillary force: surface with dσ/dT > 0 makes up 20% with the TCFE15 table and 79% with the sulfur-only table. Net force behind the hottest point (thermocapillary + composition difference, inward positive): −25 Pa with the TCFE15 table (inward over 37% of the area), +118 Pa with the sulfur-only table (86%).
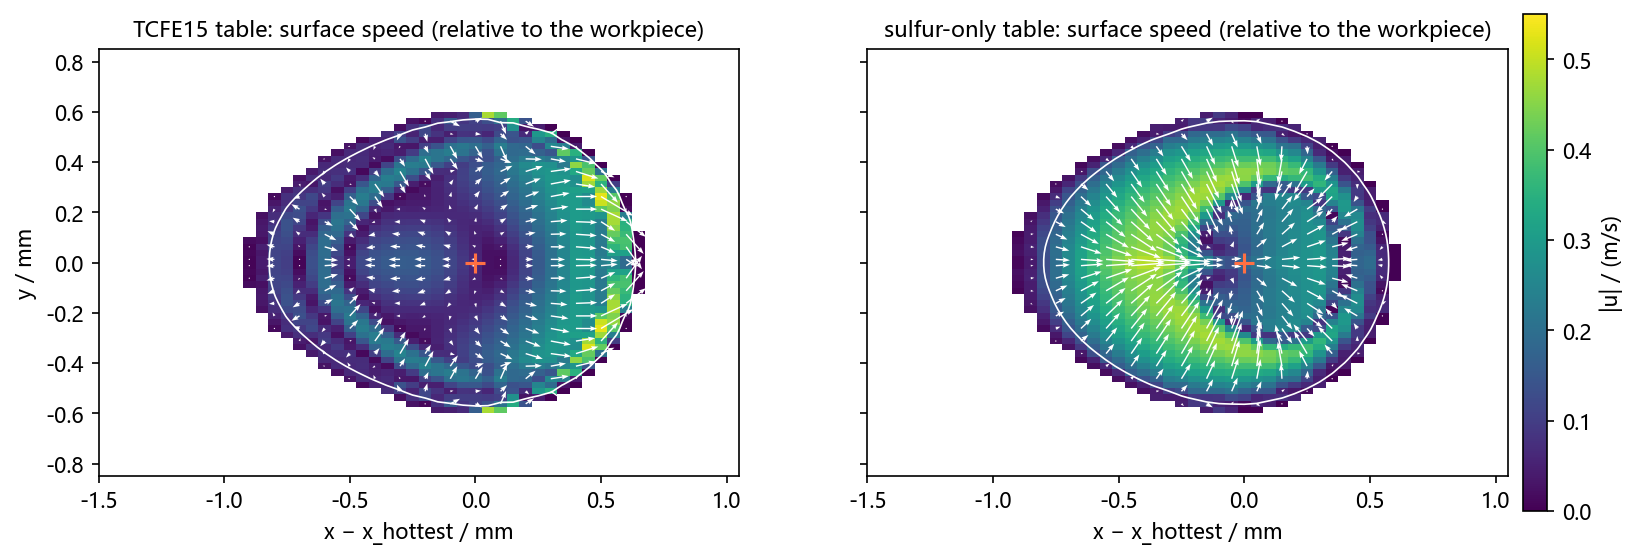
Surface speed: share of the surface flowing inward, 27% with the TCFE15 table and 74% with the sulfur-only table.
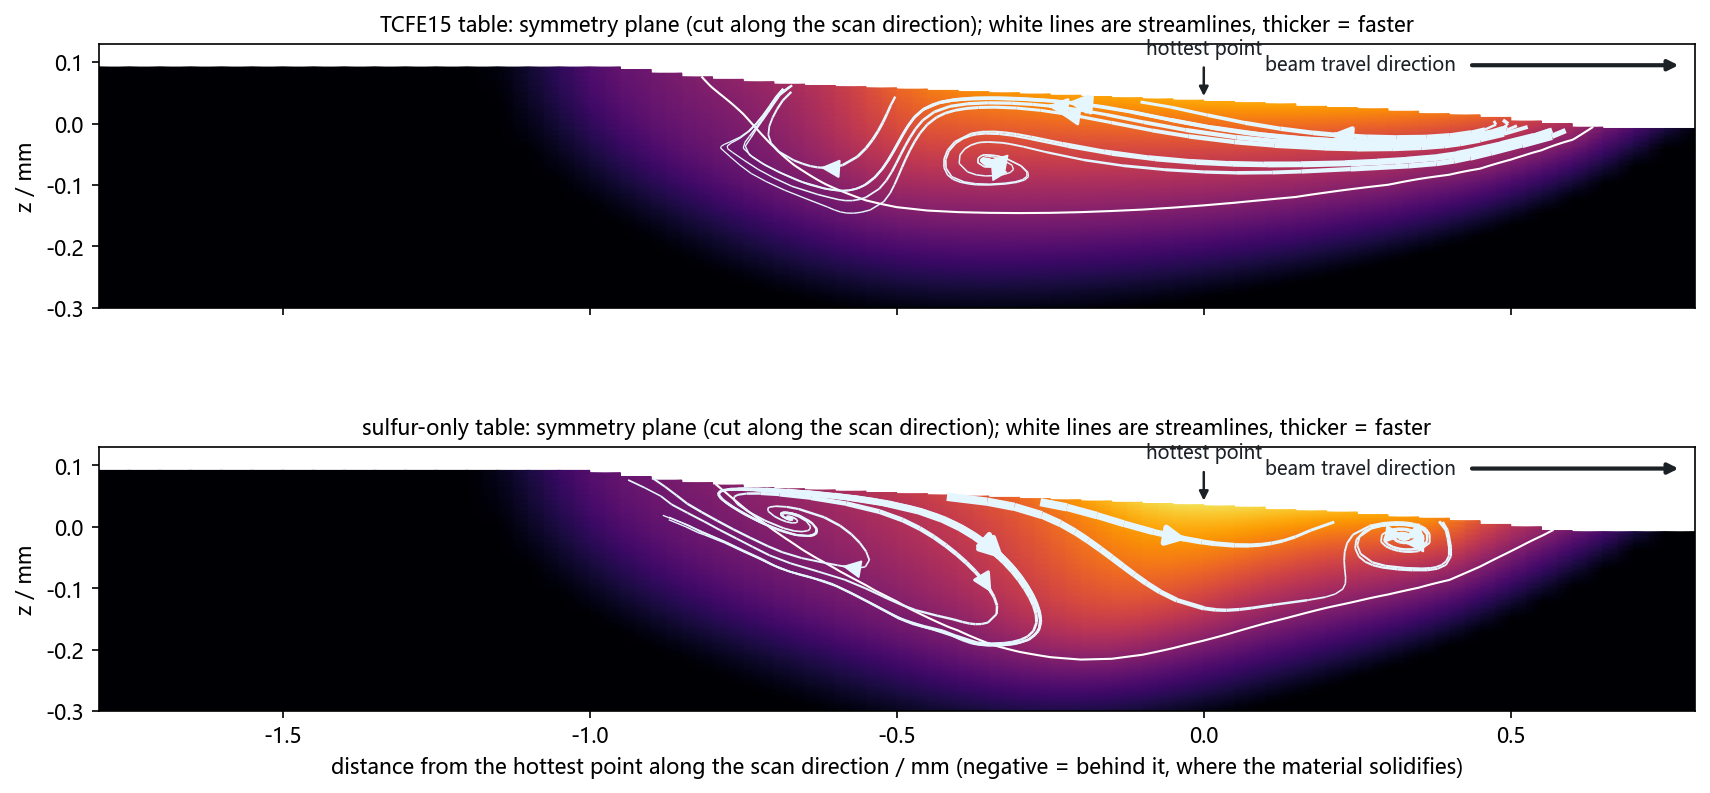
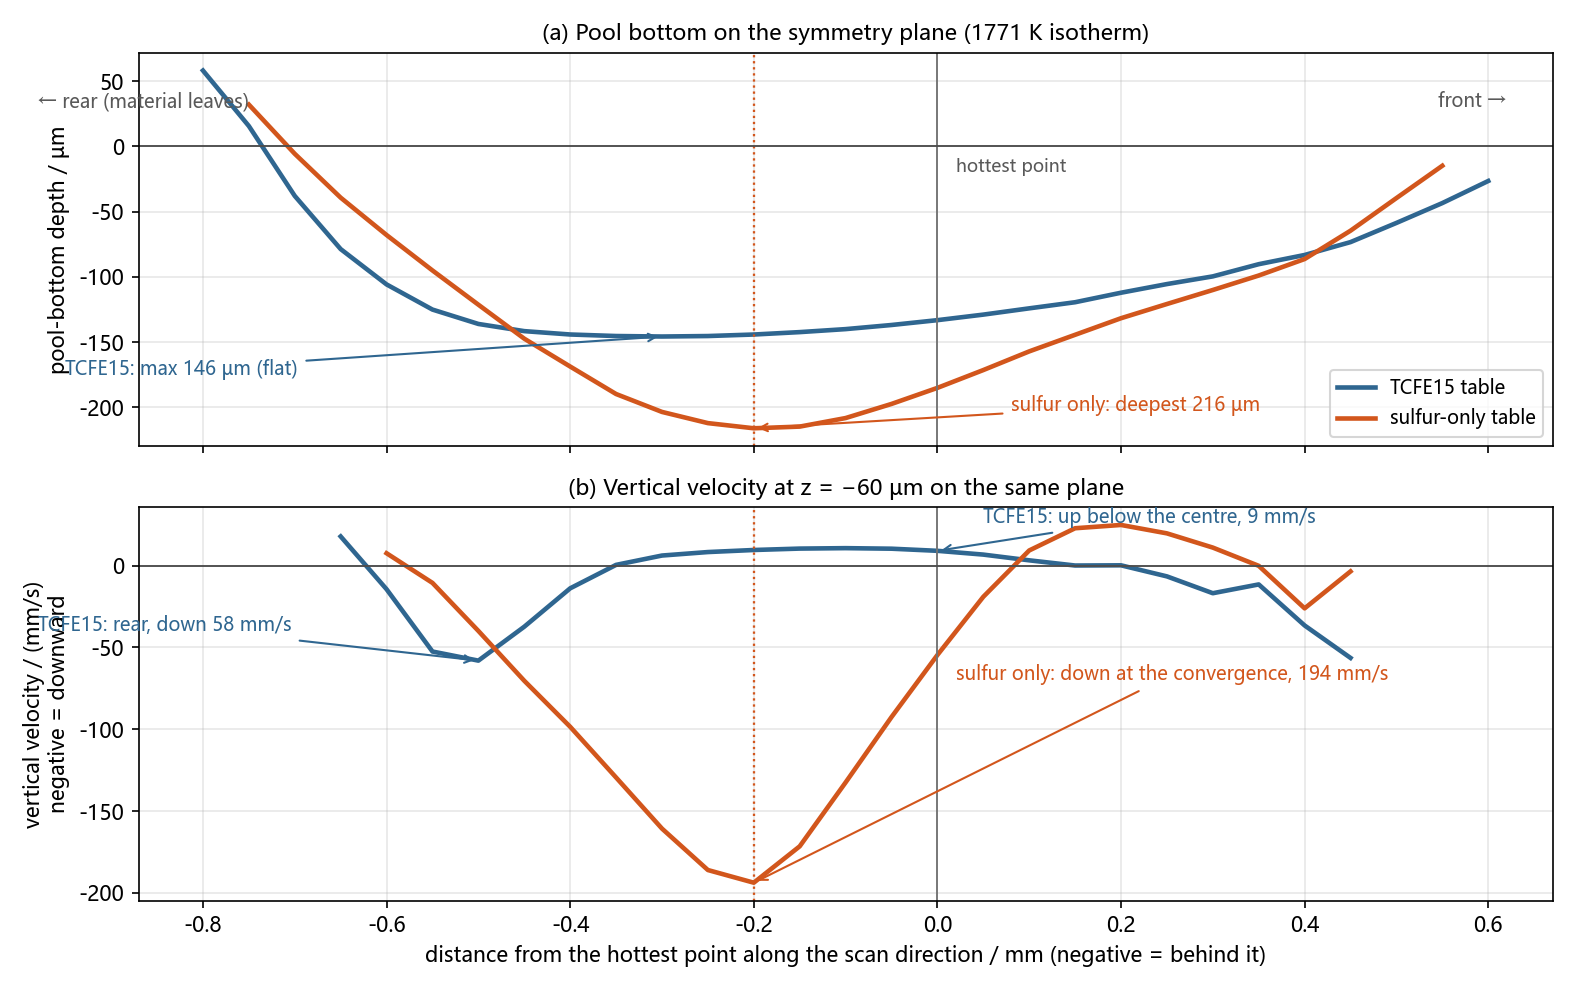
Sulfur-only table: the downwelling is strongest 0.20 mm behind the hottest point (194 mm/s at 60 µm below the surface), and the pool is deepest right there, 216 µm; with the TCFE15 table there is an upwelling below the hottest point (9 mm/s), the bottom is flat and the deepest point is 146 µm.

The dashed line is the sulfur-only table with an eddy viscosity added. Fluctuations are the ceaseless variation of the velocity about its time average; in the transient model they are of the same order as the mean flow. The steady model solves for a steady state and cannot produce fluctuations; their transport of composition and heat is already included in the steady model through an equivalent diffusion Dt and an eddy conduction, but their transport of momentum was not, and the eddy viscosity νt = Sct·Dt supplies exactly that term (Sct = 0.1, the same value at all four powers; see section 1.7).
1.5 Simulation results of five ways of calculating: four treatments of the surface-active elements, and conduction only
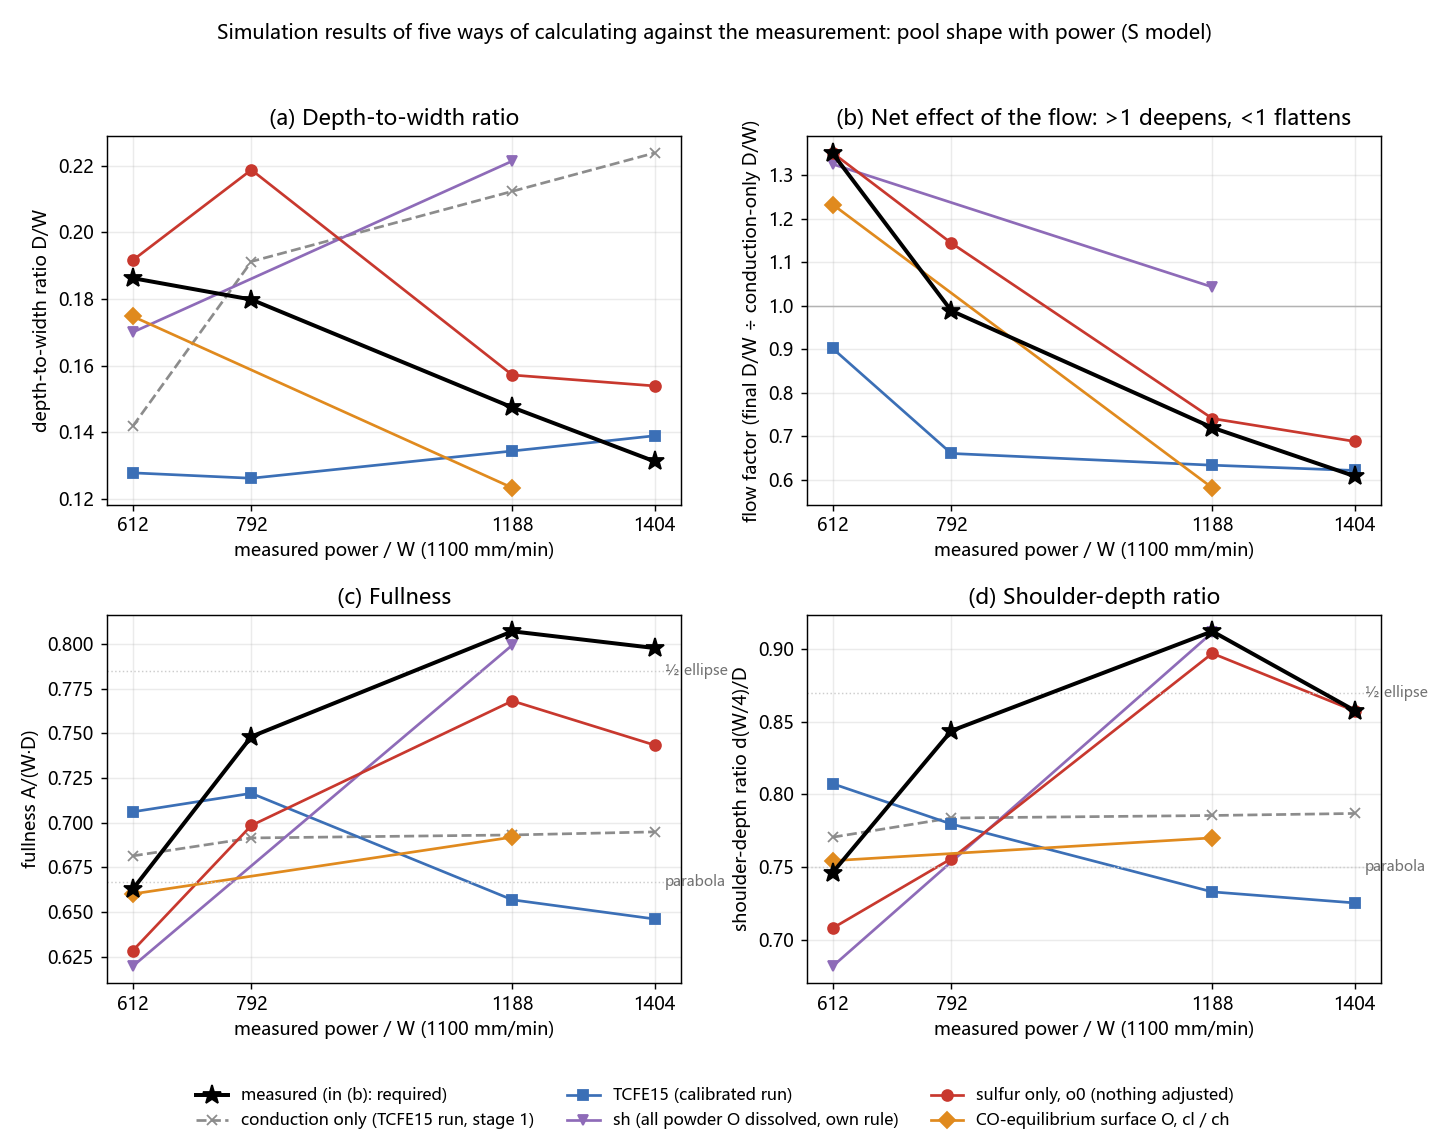
The five ways of calculating in the figure: conduction only (grey dashed line), with no flow, as the reference; the TCFE15 table (blue squares), without adsorption of oxygen or sulfur; the sh table (purple triangles), all the powder's oxygen dissolved plus sulfur, with a combination rule of our own; the sulfur-only table (red circles), with the oxygen dissolved at the surface set to zero; the CO-equilibrium table (orange diamonds), with the same sulfur and the surface oxygen at its value in equilibrium with CO. The last four are four treatments of the surface-active elements; the sulfur-only and CO-equilibrium tables share η and mesh with the TCFE15 table, and the sh and CO-equilibrium tables were run only at 612 and 1188 W (for these two see section 1.6). Black stars are the measurement; in (b), the flow factor the measurement requires.
| Power | Required flow factor | Sulfur-only table | TCFE15 table | Fullness: measured / sulfur-only | Shoulder-depth ratio: measured / sulfur-only |
|---|---|---|---|---|---|
| 612 W | 1.35 | 1.351 | 0.901 | 0.66 / 0.63 | 0.75 / 0.71 |
| 792 W | 0.99 | 1.144 | 0.660 | 0.75 / 0.70 | 0.84 / 0.76 |
| 1188 W | 0.72 | 0.740 | 0.633 | 0.81 / 0.77 | 0.91 / 0.90 |
| 1404 W | 0.61 | 0.688 | 0.621 | 0.80 / 0.74 | 0.86 / 0.86 |
The sulfur-only table (S = 90·(1 − f) ppm in the σ table, zero oxygen dissolved at the surface, adsorption constants from the literature, not adjusted for this case) reproduces the change of the flow's effect from deepening to flattening with power, and the change of the section from parabolic to flat-bottomed with steep walls; the TCFE15 table goes the opposite way at 612 W.
1.6 Oxygen at the surface: three estimates, and the basis for taking "sulfur only"
Oxygen comes in only with the powder (certificate 420 ppm, mostly in a Cr-rich oxide film about 11 nm thick on the particle surface) and enters the pool, in proportion to f, at about 100–180 ppm. How much of it remains at the surface depends on where it goes. Sulfur is different: it comes only from the substrate, is dissolved in the melt, and has no way out through the gas phase.
| Estimate of surface dissolved oxygen | Value | Basis and limits |
|---|---|---|
| All dissolved and staying in the melt | 100–180 ppm | Upper bound |
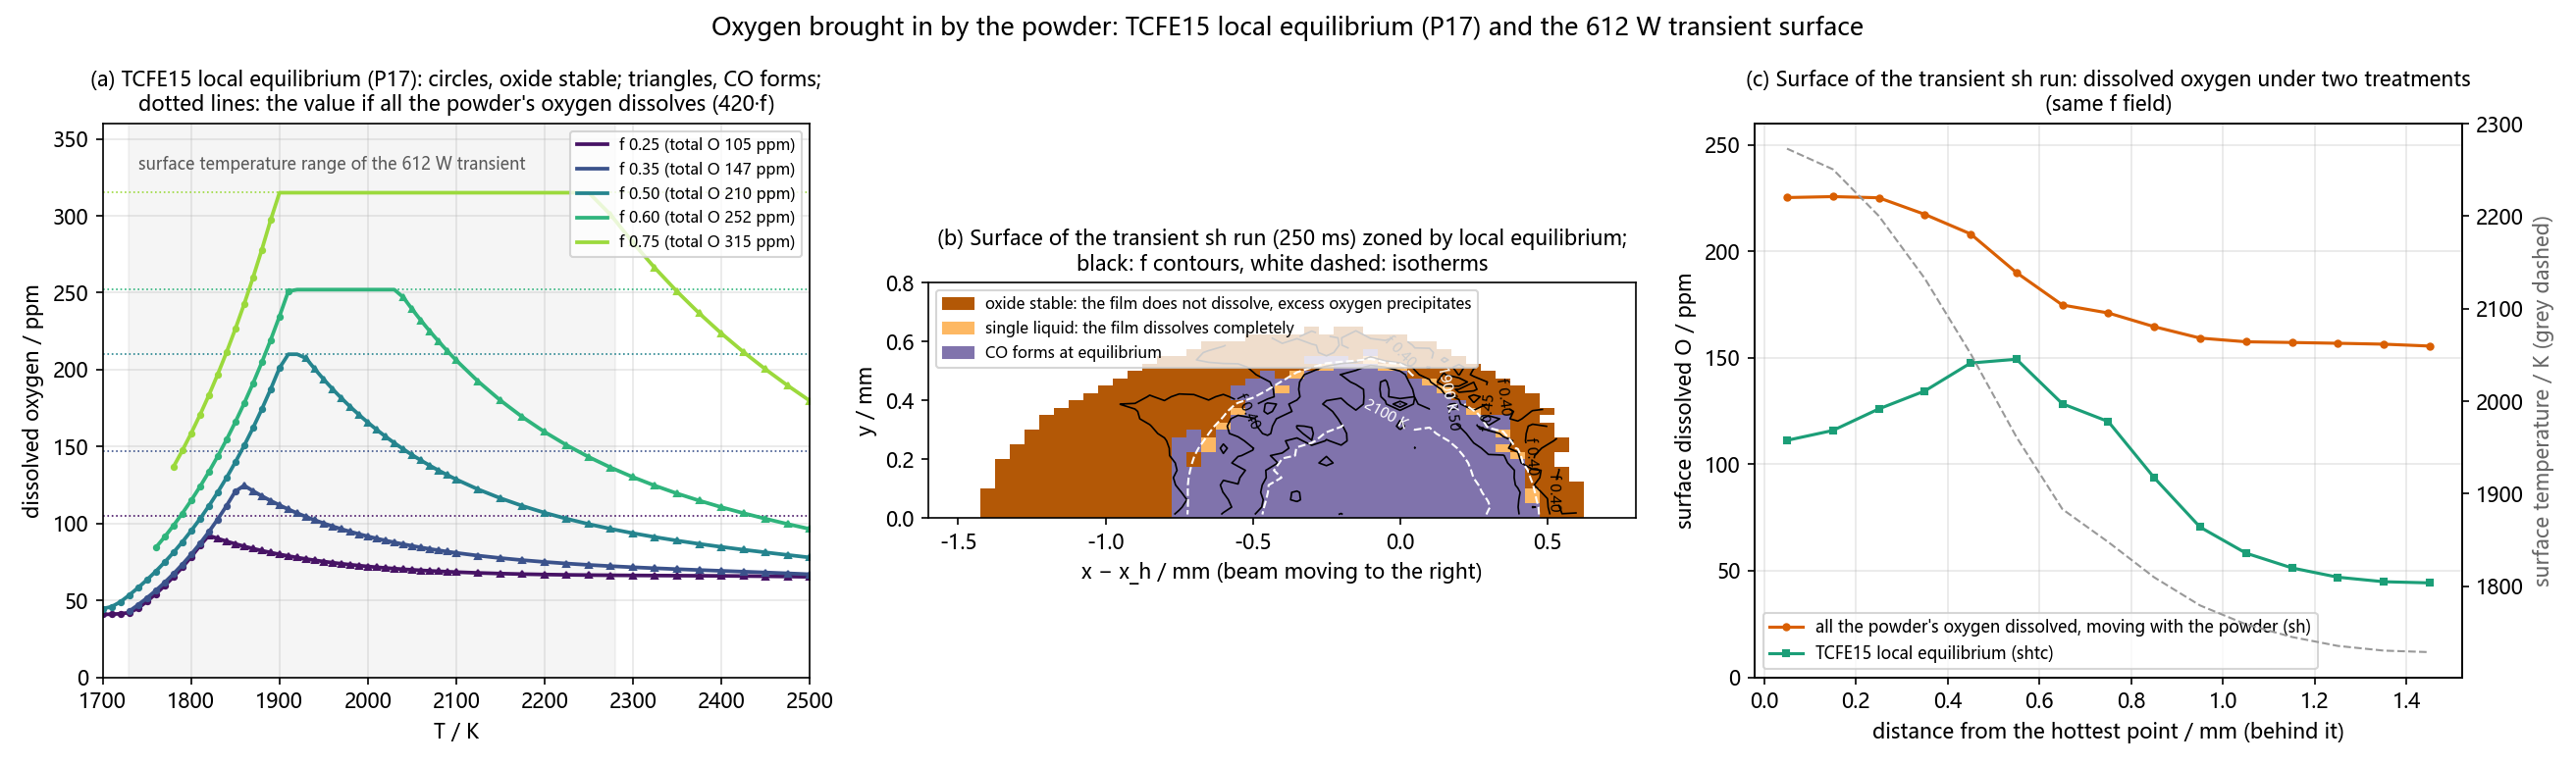
| Closed-system equilibrium (Thermo-Calc, 1 atm; figure (a) below) | 66–201 ppm (1900–2275 K, f 0.25–0.5) | The CO formed stays in the system. The surface is swept by argon and is not a closed system |
| Open system: at the surface the substrate's carbon turns dissolved oxygen into CO, which the argon carries away; the surface is in equilibrium with CO | 612, 792 W: 4–7 ppm; 1188, 1404 W: 11–17 ppm | Carbon in the melt (0.23–0.28 wt%) far exceeds oxygen; liquid-phase mass transfer can bring 33–138% of the incoming oxygen to the surface within the lifetime of the pool. The premise is a fast surface reaction (its rate has not been measured). The CO partial pressure is calculated for "all the powder's oxygen dissolves and all of it leaves as CO" and varies with the estimated gas speed (612 W: 0.040, 0.025, 0.018 atm at gas speeds of 2, 5 and 10 m/s; this page takes the middle one) |
The third is a forward estimate with a physical basis, and it is an upper bound for a fast surface reaction: the part of the powder's oxygen that does not dissolve but stays in fragments of oxide film does not enter this budget, and the oxygen dissolved at the surface is lower in proportion. The oxygen dissolved at the surface therefore lies between 0 and this estimate, the upper bound being 4–9% of the all-dissolved value; sulfur (55–67 ppm) is the main adsorbing element. The sulfur-only table takes the lower end of this range and the CO-equilibrium table the upper end, with the same sulfur in both. Results of the two ends in the steady model (same η and mesh, differing only in the surface oxygen):
| σ table | Surface O in the run / ppm 612 / 1188 W | Tc below sulfur-only by / K 612 / 1188 W | Flow factor 612 / 1188 W | Fullness 612 / 1188 W |
|---|---|---|---|---|
| Upper end: CO equilibrium (same sulfur) | 4–6 / 11–18 | 20 / 56 | 1.233 / 0.581 | 0.66 / 0.69 |
| Lower end: sulfur only | 0 / 0 | 0 / 0 | 1.351 / 0.740 | 0.63 / 0.77 |
| Measured | 1.35 / 0.72 (required) | 0.66 / 0.81 |
- 612 W: both ends hold. Both ends deepen the pool, and the CO-equilibrium table gives the same section shape as measured (fullness, shoulder-depth ratio, wall-depth ratio 0.66, 0.75, 0.35; measured 0.66, 0.75, 0.34). This power tolerates 0 to about 6 ppm of surface oxygen and cannot tell the two ends apart.
- 1188 W: the upper end flattens too much. 11–18 ppm of oxygen dissolved at the surface lowers Tc to 1925–1950 K (oxygen does not leave the surface on heating, section 1.3); with Tc lower, the part of the surface hotter than Tc, which flows outward, grows to 75%, the convergence of the two surface flows moves to the pool edge, and the box shape becomes a round bowl. The box shape allows only about 2–4 ppm, which is one sixth to one third of the upper end: either most of the powder's oxygen does not dissolve at high power (fragments of oxide film stay in the pool and float on the surface), or gas-phase mass transfer at the surface is more than three times faster than estimated. This is inferred from the shape and has no independent evidence.
- The standing of "sulfur only". What has a basis: the sulfur content (substrate mill certificate 90 ppm, diluted by 1 − f), the adsorption constants (literature, 1.3 appendix) and the range of the surface oxygen (0 to the CO-equilibrium estimate). What is open: where in this range the oxygen lies, and the premise of a fast surface reaction. The sulfur-only table takes the lower end: at 612 W it cannot be told from the upper end, and at high power only the section shape supports it so far. Deciding it needs the total oxygen of the deposit (inert-gas fusion, section 4) and the number of oxide inclusions in SEM of the section.
- Inferred backward from the force balance on the surface, the shape allows 0.0–13.4, 11.3–15.2, 0.0–2.0, 2.3–4.9 ppm of oxygen dissolved at the surface (612, 792, 1188, 1404 W).
- The sh table (an earlier version in this project: all the powder's oxygen dissolved, plus sulfur) is no longer used, for two reasons. Its oxygen content is the upper bound, with nothing counted as leaving as CO. And its combination rule for oxygen and sulfur was our own: when oxygen is added in the presence of sulfur, our rule raises Tc, whereas the literature expression (Small, Sahoo & Li 1990) lowers it, and above 50 ppm of oxygen dσ/dT is negative everywhere (table below). With the sh table 612 W deepens (flow factor 1.325) and so does 1188 W (1.043, required 0.72).
| Oxygen at the surface | Combination rule | Tc / K (surface at 612 / 792 / 1188 / 1404 W) none = no positive-slope range |
|---|---|---|
| 0 (sulfur only) | literature expression | 2060 / 2076 / 2022 / 2017 |
| 15 ppm | literature expression | 2011 / 2031 / 1961 / 1955 |
| 50 ppm | literature expression | none / none / none / none |
| 420·f (all the powder's oxygen dissolved) | our own rule (sh, no longer used) | 2207 / 2190 / 2253 / 2259 |
| 420·f (all the powder's oxygen dissolved) | literature expression | none / none / none / none |
1.7 Robustness checks
- Adsorption constants of sulfur. The project takes Su, Li & Mills 2005 (a fit to measurements on stainless steels): for austenitic stainless steel dσ/dT changes sign at 29 ppm and is +0.116 mN/(m·K) at 60 ppm (Brooks & Quested 2005 measured 44 ppm and +0.106). With the pure Fe–S constants of Sahoo 1988 (sign change at 104 ppm), 612 W no longer deepens (flow factor 0.855) and 1188 W flattens too much (0.541): both ends miss.
- Mesh. Refining the near-surface cells from 12 µm to 6 µm: flow factor 1.409 → 1.401 at 612 W and 0.733 → 0.722 at 1188 W.
- Beam width: its effect on depth is as large as that of the flow, and the actual beam profile has not been measured. With a beam one third narrower than the nameplate (r₀ 480 µm; nameplate 707 µm), the conduction-only depth-to-width ratio at 612, 792 and 1188 W is multiplied by 1.35, 1.27, 1.25. The deepening that the 612 W measurement requires (×1.35) can come entirely from this: without flow, conduction alone matches width, depth and area together (η about 0.28). With the narrow beam and the sulfur-only table at matched area, width / depth differ from the measurement by −5% / −4% at 612 W, −6.1% / +3.9% at 792 W and +5.1% / +10.8% at 1188 W (1404 W not run). The two explanations are told apart by how the section shape changes with power: with the narrow beam the fullness is 0.70, 0.759, 0.652, not monotonic, and 1188 W is parabolic; with the nameplate beam it is 0.62, 0.68, 0.77, in the same direction as measured (0.663, 0.748, 0.807). The beam profile has not been measured and the "narrow beam" explanation is not ruled out; one burn paper at the 15 mm working distance would settle it.
- Eddy viscosity. After the steady model is given the fluctuations' transport of momentum (fluctuations: the variation of the velocity about its time average, see the caption in section 1.4) through νt = Sct·Dt (Sct = 0.1, calibrated once for all four powers, outside the 0.5–1 usual for turbulence), width, depth and area differ from the measurement at the four powers by: 612 W width +8.2%, depth −2.9%, area +3.1%; 792 W width −0.3%, depth +6.0%, area −1.7%; 1188 W width +3.3%, depth +1.6%, area −0.6%; 1404 W width −1.0%, depth +6.1%, area −0.6%.
1.8 Status
Steady and transient runs now both use the sulfur-only table. The transient on the coarser mesh still does not deepen: hot-state depth-to-width ratio 0.132 at 612 W (cold 0.139); with the surface tension looked up at the nominal composition (composition coupling removed) it is still 0.137 (cold 0.148). The difference between the two models has causes besides the surface-tension table; fixes 2 and 3 address two of them.
2 Fix 2: mesh
The detailed tests are on the page "Mesh Resolution of the Surface Flow": v3.ded-surface-flow.pages.dev.
- The med mesh. Near the surface it is 24 µm along the scan direction and 12 µm transverse and vertical. Extrapolating the thermocapillary cavity case over three mesh levels, 12 µm vertically makes the surface speed about 26% too low; the 09-18 view that the mesh "cannot resolve the Marangoni boundary layer and the speed is 384 times too low" was refuted on 09-19: the boundary-layer thickness is accurate to 1% with only 1.8 cells.
- What matters is the downwelling at the convergence. The two surface flows converge and sink along the ring where the surface temperature is about Tc, carrying heat to the pool bottom. In the converging-flow cavity (4 µm vertically, with 10 µm along the surface as the reference), at 50 µm along the surface the hot-side surface speed is −52.5% and the downwelling flux 48 µm below the surface −96.9%; at 25 µm, −2.6% and −83.4%; at 12.5 µm, +3.3% and −31.2% (each the mean of 5 snapshots, with large fluctuations).
- G4 mesh (12.5 µm along the surface, 4 µm vertically). Over the 10 ms long run in the cavity its surface speed differs from the reference by −3.4% ± 1.8% (hot side), −7.2% ± 3.0% (cold side), but it cannot be used in the pool. The first production run failed at 141.27 ms: gas entrained where the surface flows converge became bubbles in the pool, spurious flow grew around them, and one cell heated in one step to 5000 K (Fluent's temperature limit). In the cavity, curvature smoothing reduced the dispersed gas below the surface from 7.0×10⁻¹⁵ to 6.4×10⁻¹⁶ m³; on that basis the run was repeated with curvature smoothing and a VOF Courant number of 0.1 (G4 B′), and it still failed the first check: at 128 ms there were 13 interior pool cells with gas in the majority (criterion ≤ 10) and a maximum metal speed of 7.07 m/s (criterion ≤ 5); these settings also weakened the downwelling at the convergence by 24 / 30 / 38%. It was stopped on 10-06. The static-cylinder test shows that with this cell shape a curved liquid surface is unstable already at the production time step, whatever the step size.
- G3 mesh (12.5 µm along the surface, 8 µm vertically). From the same start and over the same interval, G3 without any remedy is calmer than G4: at 128 ms there are 0 interior pool cells with gas in the majority and the maximum metal speed is 1.73 m/s. In the converging-flow cavity with the dispersed gas removed, the G3 cell shape gives a downwelling flux 10 / 13 / 18% below the reference (12 / 24 / 48 µm below the surface) and a surface speed lower by 5% (hot side), 11% (cold side); most of the 11 / 43 / 78% on which G3 was rejected earlier came from the dispersed gas.
- Status. The G3 production run (125 → 256.25 ms, 161 658 steps) is on the workstation; both returns, up to 137 ms, passed, and it is expected to finish on 10-11. The question it answers: with the finer mesh, does the 612 W transient with the sulfur-only table deepen.
3 Fix 3: powder entry
- Problem. The transient model adds the powder mass to the interface cells of the free surface, so CoCrNi appears on the surface: in the sulfur-only 612 W transient the median surface f is 0.419, against about 0.30 in the bulk; the equivalent diffusion of the steady model mixes the surface towards the bulk (surface f 0.24–0.29).
- Consequence. Where the surface is powder-rich σ is low, and the surface-tension gradient due to the composition difference (the solutal Marangoni stress) opposes the thermocapillary stress: on the same transient surface the thermocapillary stress is −77.6 Pa (inward) and the solutal stress +48.7 Pa (outward), −28.9 Pa in sum.
- Real powder. Estimated from the particle size (15–53 µm) and falling speed, the particles carrying most of the mass melt only about 50–200 µm below the surface; if the powder mixed into only a 20 µm surface layer, the surface f would exceed the bulk by 0.124, which is just the transient's value. The transient very probably exaggerates the powder enrichment of the surface.
- Upper bound. With the surface tension looked up at the nominal composition, i.e. composition coupling removed entirely, the 612 W transient still does not deepen (hot-state depth-to-width ratio 0.137). So this fix has a limited effect on depth and mainly affects the composition at the surface and the bead top.
- Plan. A transient run with the powder released below the surface; experimentally, a vertical EDS line scan through the bead can tell directly whether the bead top is rich in Co, Cr and Ni.
4 What is needed from experiment
- A burn paper at the 15 mm working distance: fixes the beam size and profile (the beam item in section 1.7).
- An EDS area map of the cooled section and a vertical line scan through the bead: test the composition map and tell whether the surface is powder-rich (fix 3).
- Oxygen, sulfur and carbon contents of the deposit (inert-gas fusion, combustion analysis) and the sulfur content of the powder: test "most of the powder's oxygen does not stay at the surface" and "the powder contains no sulfur" (sections 1.6 and 1.8).
- SEM of the bead top: whether oxides gather near the centreline or in a ring away from it, which tests how the position of the surface convergence changes with power.
- A surface-tension measurement on a CoCrNi–Fe melt of known sulfur content (long term).